How We Give, Part 1
January 14, 2016
4 min read


On December 16, 2015, Statistics Canada published Charitable giving by individuals, a summary report on charitable giving by Canadians. Some might think this report would best serve as a sleep aid or perhaps for paper airplane material. But charity represents change in our society, it demonstrates a conscious effort by individuals to move toward (or away from) positive change in our communities. Many Canadians are only one recession, one diagnosis, or one degree of global warming away from requiring the compassion of all Canadians to survive. And at Chimp, it’s our business to empower that compassionate spirit as much as we can.
Versus the US
The report reveals that Canadian individuals gave $12.8 billion to charity in 2013. While this is a 23% increase from 2004, comparison to the US might give some of us an inferiority complex. According to a report from The Giving Institute, Americans gave $258 billion to charity in 2014. Yes, the United States is a much more populous nation, but they still outpace us if you break the numbers down to per capita giving, with Canadian per capita giving at $365 and American at $800. If you want to catch up, get out your chequebook (or sign up for a Chimp account).
In addition to differing totals, there appears to be some difference in causal giving between the two nations. The lion’s share of charity goes to religious-based organizations in both countries. Americans gave 32% of charitable dollars to organizations based on faith, a country where 76.6% of the population identifies with an organized religion. The surprise comes in Canada, where nearly the same proportion of the population identifies as religious (76%), yet 41% of all donations go to faith-based charities.
Where Canadians Gave Money
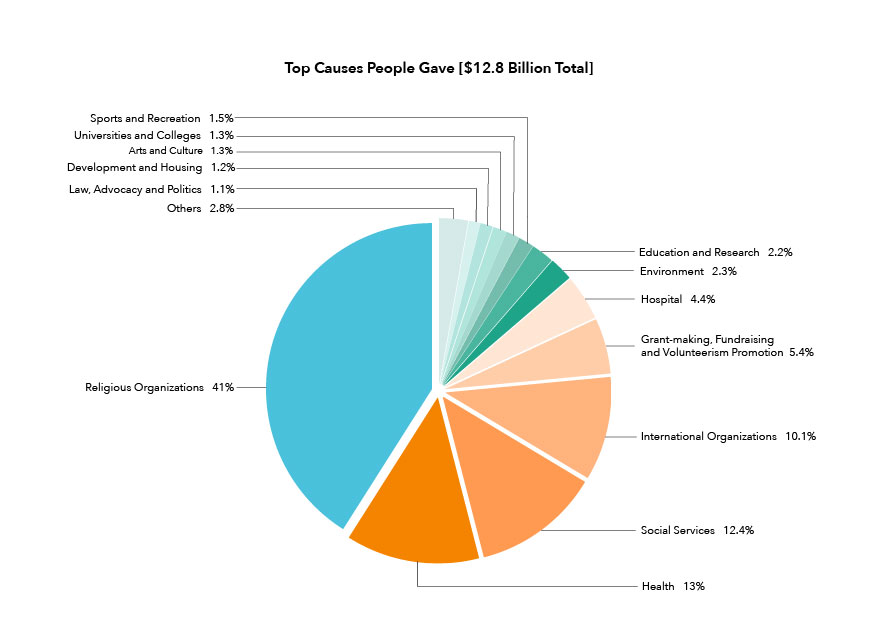
Between 2004 and 2013, many of the causes that Canadians gave money to changed significantly. International aid charities noted a 203% increase in donations over the average, community development organizations got 86% more funding, and social services received 49% more donor contributions than in 2004. A major reduction in funding was seen in the sports and recreation sector, with 22% less funding in 2013 than in 2004. Other areas such as religion and environment stayed relatively consistent.
Inequality
The report defines primary donors “as the 10% of individuals who gave the most money during the year ($1,150 or more).” These donors gave 66% of total donations in 2013. While we can’t say that every primary donor is a wealthy individual, we can infer that primary donors value charitable tax receipts more than other donors. A majority (78%) of donors who gave more than $500 reported that they planned on claiming a tax credit, versus 25% of donors who gave less than $100. Additionally, almost double (44%) the number of primary donors reported that a government tax credit was an important reason for donating, versus 23% of other donors. But does it matter why people are giving? Perhaps not, as long as the funds are making it to the organizations that need them.
However, we should also consider that, generally speaking, donors who earn the highest salaries tend to donate a smaller proportion of their income, even though their donations are on average higher (primary donors). So even though primary donors are contributing 66% of the donations, it is likely that they are earning incomes far greater, a fact backed up in the report: “30% of primary donors lived in a household in the highest income quintile, compared with 20% of other donors and 14% of non-donors.” The highest quintile is made up of individuals with incomes of $144,000 and greater.
Provincial Differences
Between 2004 and 2013, donations in the western provinces outpaced the eastern provinces compared to the national average, led mainly by Alberta and its booming oil industry, at the time. However, the survey was completed before the collapse of oil prices in 2015. So, while Alberta gave $2.4 billion in 2013, can we expect that number to dip considerably in the future? Our money is on yes.
In the next post on the StatsCan report, we’ll be looking at why Canadians give to charity, why some don’t give more, and the underlying psychology of giving. Stay tuned.